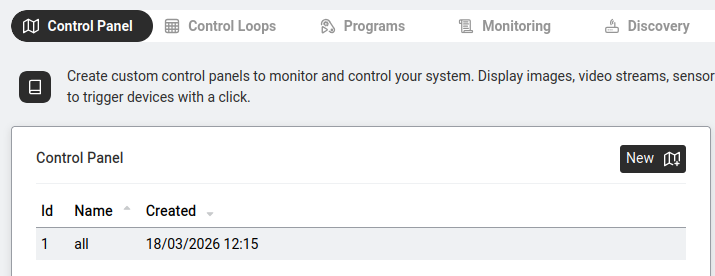
The Control Panel is the canvas where you build the visual face of your automation — a floor plan with clickable lights, lock buttons, sensor readouts, and live camera feeds, all on one page.
Navigate to Automation > Control Panel. This is where you build visual dashboards that represent your building. Imagine a floor plan of your office with clickable light switches, door locks, temperature readings, and even live camera feeds — all on one screen.
Each panel is a rectangular canvas (default size: 800 × 400 pixels). You can place:
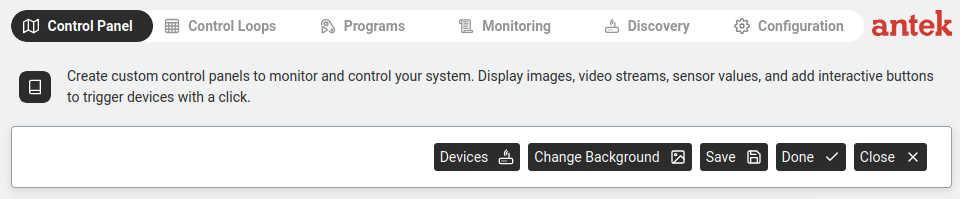
When you click New + or edit an existing panel, the editing toolbar appears at the top with these buttons:
| Button | What It Does |
|---|---|
| Devices | Opens a dialog showing all discovered automation devices. Select one to add it to the canvas. If no devices are connected, you'll see "No devices have been discovered" — in that case, find devices first via Monitoring & Discovery (the Discovery view lists newly-detected devices on the network). |
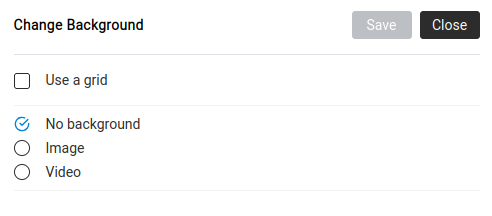
| Change Background | Opens a dialog with three options:
— No background — plain white canvas — Image — upload a .jpg or .png file (e.g. your floor plan) — Video — embed a live camera stream as the background A checkbox "Use a grid" overlays alignment dots to help position devices neatly. |
| Save | Save your changes. |
| Done | Exit editing mode and view the finished panel as a user would see it. |
| Close | Close the panel without saving (changes are lost). |
When you're not editing, the panel is interactive: