| 63.19. How to trace the internal events for debugging purposes | ||
|---|---|---|
 | Chapter 63. HowTo - Management |  |
| 63.19. How to trace the internal events for debugging purposes | ||
|---|---|---|
| | Chapter 63. HowTo - Management | |
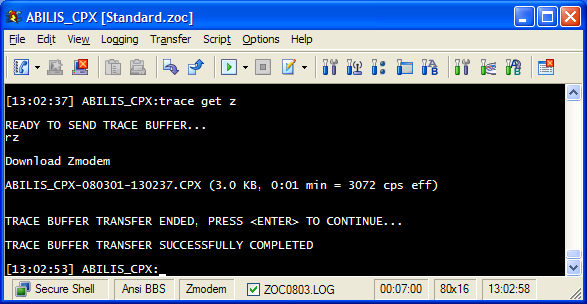
Enter into the Abilis control-program with a Terminal Emulator with file transfer support (e.g. Windows HyperTerminal, Zoc, ecc...), and type the following commands.
| d pstack | Identify the internal port number associated to the resource for which you want to activate the trace. (e.g. suppose the ETH100-1 resource). |
| trace act po:24 data:1600 | Activate the trace function. |
| trace start | Start saving the events. |
| trace stop | Stop tracing the events. |
| trace get z | Download the trace from Abilis. |
![[Warning]](../images/warning.png) | Warning |
|---|---|
Verify the parameters settings of the internal events trace using the command trace param. If a trace is runnig the following message is shown: [14:04:34] ABILIS_CPX:The trace continues to be active on ports shown by trace param command and not on those specified by trace act command. [14:04:50] ABILIS_CPX:Stop the trace and set it inactive: [14:13:42] ABILIS_CPX: Configure the trace and follow the steps of the how to: [14:17:40] ABILIS_CPX: |
For example, if you use Zoc program:
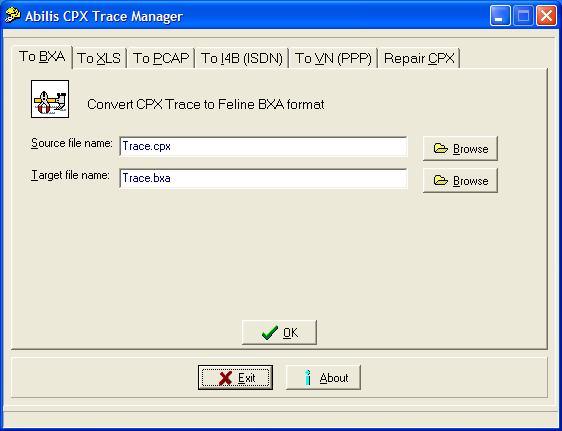
Abilis CPX traces are saved in a proprietary format “cpx”. Follow these instructions to convert them in other formats (pcap, bxa, ...).
Go to http://abilis.antek.it/downloads/cpx2k/download.html
and click the System and tools link of
the firmware Release that you want to use; in the following page,
download download a “Trace Converter” program
(cpxbxa.exe, cpxtab.exe,
cpxpcap.exe or
trcmgrw.exe).
![[Note]](../images/note.png) | Note |
|---|---|
Access to download section is restricted, before proceeding you
need to obtain a valid username/password from Abilis technical support
( |
For example, the “GUI CPX trace converter”
(trcmgrw.exe) converts Abilis CPX traces
into:
BXA : is an old format used by FELINE data analyser.
“TAB separated”: is a general purpose format usable to import data into OpenOffice or Excel speadsheets.
PCAP: is used by Ethereal/Wireshark/Tcpdump for Ethernet/PPP/RawIP representation.
I4B: it is a format for ISDN layer 1 representation and it can be loaded by Ethereal/Wireshark.
VN: Visual Network format; it can be loaded by Ethereal/Wireshark for PPP representation.
For example, if you want to convert the trace in PCAP format, follow these instructions.
Double click the trcmgrw.exe file: the
following window will appear.
In the To PCAP tab, select the in the Source file name field the trace that must be converted and in the Target file name field the name of the new trace.
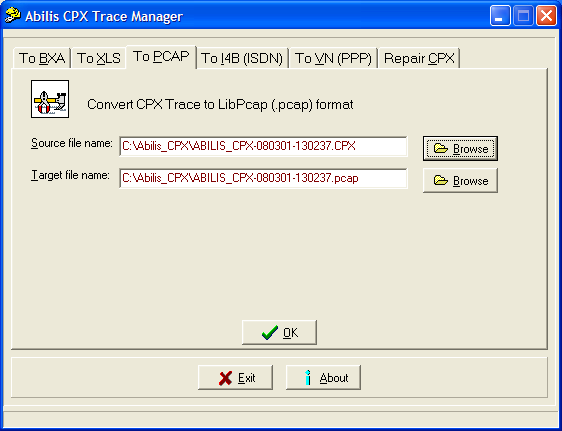
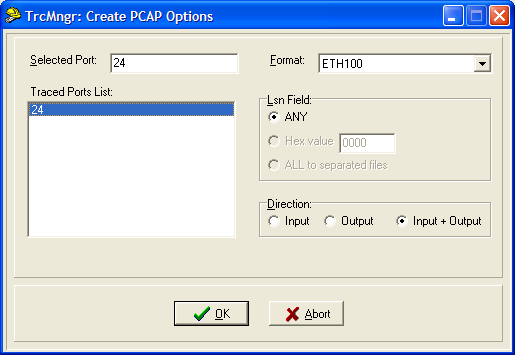
Click the button: in the next window select the port traced and the format.
Click the button: the result of the conversion is shown.
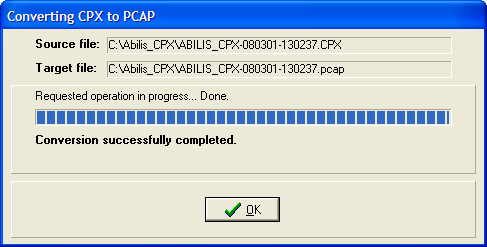
Click the button to close the window and then the button to close the program.
| |  | |
| 63.18. How to configure Abilis as a SYSLOG client |  | Chapter 64. HowTo - Networking |